STM Transit Dashboard- Société de transport de Montréal, QC | Power BI

This project analyzes STM public transit operations in Montreal using Power BI.The goal was to understand how routes, stops, and trips operate across the city and identify patterns like busy routes, peak travel hours, stop activity, and accessibility coverage.
The dashboard helps answer operational questions such as:
Which routes run the most trips?
Which stops are the busiest?
What time of the day has the highest trip activity?
How accessible are stops for wheelchair users?
The analysis was done using GTFS transit data, which includes routes, trips, stops, schedules, and service calendars. The dataset came from STM GTFS data.
It contains multiple tables describing transit operations.
Important tables used in the project:
agency.txt
This table contains information about the transit agency operating the service.
Column | Description |
agency_id | Unique identifier of the transit agency |
agency_name | Name of the transit agency |
agency_url | Official website of the agency |
agency_timezone | Timezone in which the agency operates |
agency_lang | Default language used by the agency |
agency_phone | Customer support phone number |
agency_fare_url | URL where fare information is available |
feed_info.txt
This table provides metadata about the dataset itself.
Column | Description |
feed_publisher_name | Name of the organization publishing the data |
feed_publisher_url | Publisher website |
feed_lang | Language of the dataset |
feed_start_date | Date when the feed becomes valid |
feed_end_date | Last date covered by the dataset |
feed_version | Version identifier of the dataset |
routes.txt
This table contains information about all transit routes.
Column | Description |
route_id | Unique identifier of the route |
agency_id | Agency operating the route |
route_short_name | Short route number |
route_long_name | Full route name |
route_type | Type of transit (bus, metro, etc.) |
route_url | Link to route information |
route_color | Color used for route visualization |
route_text_color | Text color used on route display |
Example routes include:
Line 1 – Green
Line 2 – Orange
Line 4 – Yellow
Line 5 – Blue
trips.txt
This table represents individual trips made by vehicles on routes.
Column | Description |
route_id | Route on which the trip runs |
service_id | Service schedule for the trip |
trip_id | Unique trip identifier |
trip_headsign | Destination displayed on vehicle |
direction_id | Direction of the trip |
shape_id | Geographic path of the trip |
wheelchair_accessible | Indicates wheelchair accessibility |
A route can have many trips.
stop_times.txt
This table describes when a vehicle arrives and departs from each stop during a trip.
Column | Description |
trip_id | Trip identifier |
arrival_time | Scheduled arrival time at the stop |
departure_time | Scheduled departure time |
stop_id | Stop identifier |
stop_sequence | Order of stops in the trip |
pickup_type | Whether passengers can board |
This table is important because it connects:
Trips → Stops → Time
stops.txt
This table contains information about all transit stops and stations.
Column | Description |
stop_id | Unique identifier for the stop |
stop_code | Public stop code |
stop_name | Name of the stop |
stop_lat | Latitude coordinate |
stop_lon | Longitude coordinate |
stop_url | URL with stop information |
location_type | Type of stop (station or platform) |
parent_station | Parent station if applicable |
wheelchair_boarding | Indicates accessibility availability |
These coordinates allow map visualization.
shapes.txt
This table defines the geographic path that a transit route follows.
Column | Description |
shape_id | Unique identifier of the route shape |
shape_pt_lat | Latitude of a point on the route |
shape_pt_lon | Longitude of a point |
shape_pt_sequence | Order of points along the route |
These points help draw routes on the map.
calendar.txt
This table describes regular service schedules.
Column | Description |
service_id | Service schedule identifier |
monday – sunday | Indicates whether service runs on each day |
start_date | First day of service |
end_date | Last day of service |
Example:
If monday=1 and sunday=0 → service runs on weekdays.
calendar_dates.txt
This table stores special schedule changes.
Column | Description |
service_id | Service identifier |
date | Date of exception |
exception_type | Type of change |
Exception types include:
1 → Service added2 → Service removed
This helps account for holidays or special events.
translations.txt
This table provides translated text for different languages.
Column | Description |
table_name | Table being translated |
field_name | Column name |
language | Language code |
record_id | Record identifier |
translation | Translated text |
Example:Route names translated into English.
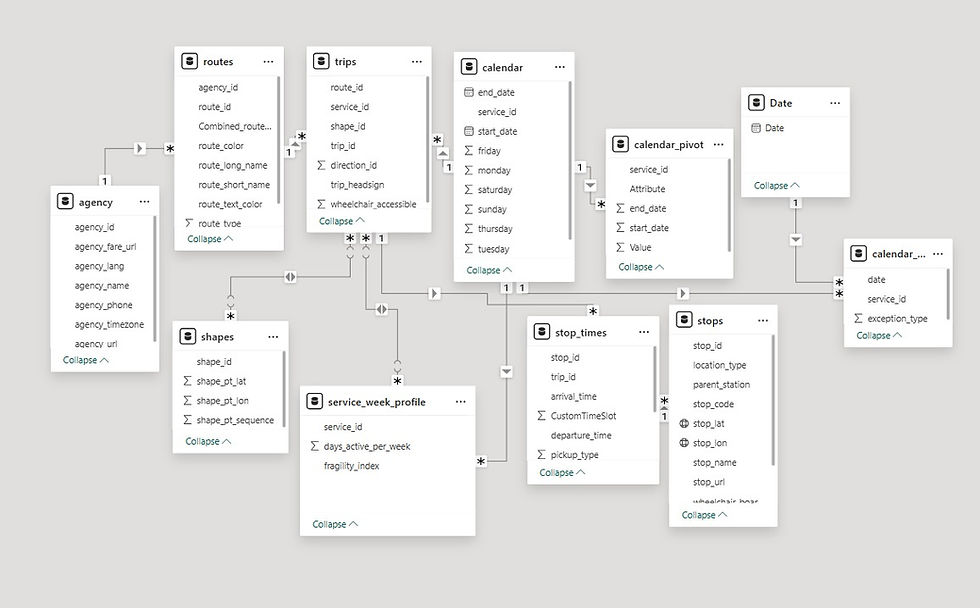
I built a relational data model connecting all tables.
Key relationships:
routes → trips
trips → stop_times
stop_times → stops
calendar → trips
This allowed me to analyze trips across routes, stops, and time dimensions.
I also created a date table to support time analysis.
I cleaned and prepared the data.
Examples:
Created Combined Route Name
Extracted time slots (Morning, Afternoon, Evening, Night)
Calculated days active per week
Created custom time categories
This made the dataset easier to analyze.
I created several measures in Power BI such as:
Total Routes
Total Trips
Total Stops
Trips during Peak Hours
Trips per Route
Trips per Stop
Wheelchair accessibility percentage
These metrics allow quick operational insights.

This page gives a high-level summary of STM transit operations.
Key KPIs displayed:
Metric | Insight |
Total Routes | 215 routes operating |
Total Trips | 273,967 trips |
Total Stops | 8,745 stops |
Wheelchair Accessible Stops | 8,950 accessible stops |
Key Insights
Most active routes
Routes like:
747 – YUL Airport / Centre-Ville
Côte-des-Neiges
Sherbrooke
Jean-Drapeau
run the highest number of trips.
This shows where most public transit demand exists.
Service by Day of Week
Friday shows the highest service activity.
This suggests higher transit usage before weekends.
Accessibility
About 88% of stops are wheelchair accessible, indicating strong accessibility coverage in STM transit.
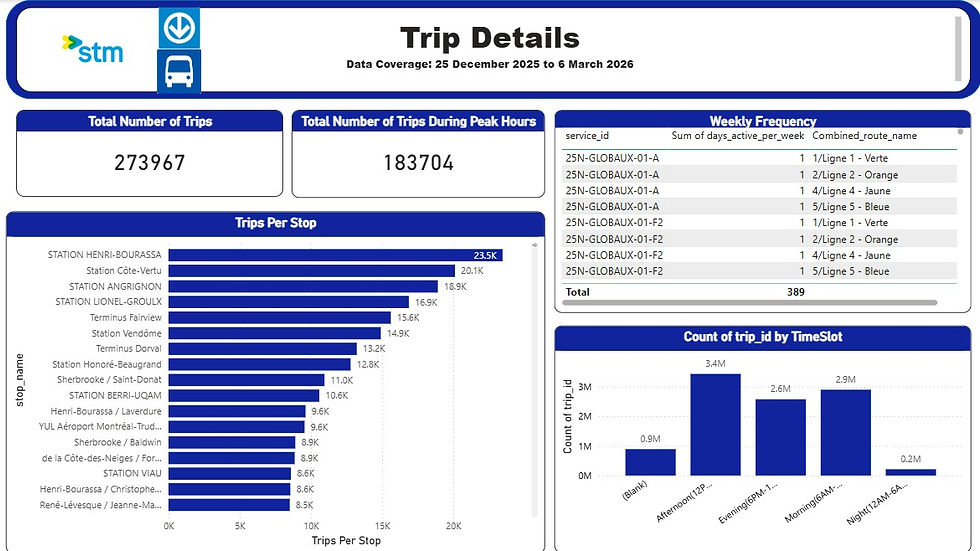
This page analyzes trip frequency and trip distribution.
Total Trips
The system recorded 273,967 trips during the analysis period.
Peak Hour Trips
Out of these:
183,704 trips occur during peak hours
This shows the majority of transit operations focus on commuter travel times.
Trips per Stop
Some stops receive significantly more trips.
Top busy stops include:
Henri-Bourassa
Côte-Vertu
Angrignon
Lionel-Groulx
These are major transport hubs or metro connections.
Trips by Time of Day
Trip distribution shows clear travel patterns.
Time Slot | Observation |
Morning | High commuter travel |
Afternoon | Highest activity |
Evening | High return travel |
Night | Very low trips |
This reflects typical urban commuting patterns.
Weekly Frequency
The weekly service table shows how often routes operate per week.
This helps identify:
High-frequency routes
Limited service routes
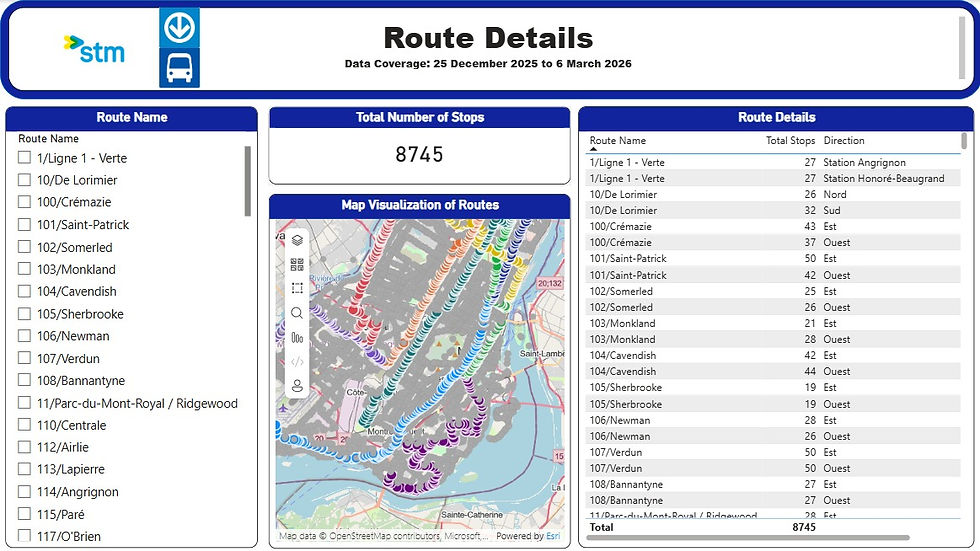
This dashboard focuses on route structure and stop distribution.
Users can select a route and see:
Number of stops
Route direction
Geographic path of the route
Map Visualization
The map shows all route stop locations across Montreal.
This helps visualize:
Transit coverage
Route density
Stop clustering in urban areas
Route Stops Analysis
The dashboard lists:
Total stops per route
Route direction
Route names
For example:
Crémazie route has over 40 stops
Saint-Patrick route has around 50 stops
This helps identify longer routes and dense transit corridors.
Github : STM Transit Dashboard- Société de transport de Montréal, QC


Comments