ChainForge - Supply chain Analytics pipeline

ChainForge is an end-to-end data engineering and analytics pipeline built on the DataCo Supply Chain dataset [180,000 records] across 4 years. The goal was to ingest raw data in multiple formats, clean and transform it using cloud tools, and deliver business insights through an interactive Power BI dashboard.
Tech Stack
Layer | Tool |
Cloud Storage | Azure Data Lake Gen2 |
Pipeline | Azure Data Factory |
Transformation | ADF Data Flow (Apache Spark) |
Visualization | Power BI |
Validation | MySQL |
Language | Python, DAX, SQL |
Step 1 — The Dataset
The DataCo Supply Chain dataset contains order, shipping, customer, and product data across 4 years (2015–2018). Raw data had 53 columns, mixed date formats, masked fields, inconsistent delivery statuses, and price formatting issues making it a realistic dirty dataset to work with.
To make it more challenging and realistic, the dataset was intentionally corrupted using Python before uploading to the cloud:
Dates --- 6 different formats mixed randomly
Customer names --- salutations added (MR. MRS. MS.)
Product prices --- currency symbols added ($, USD)
Delivery status --- random casing variations
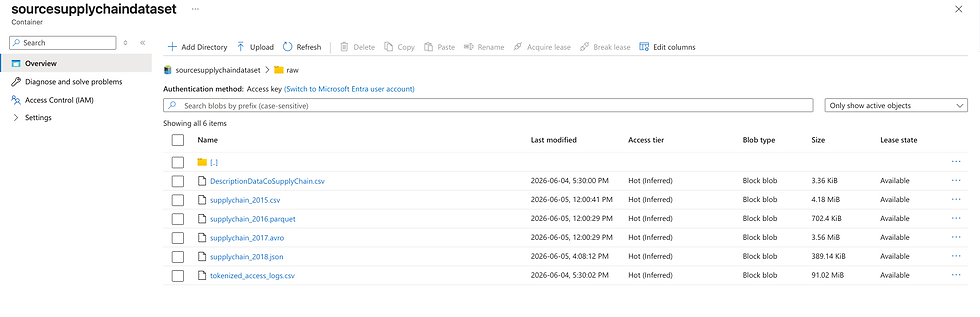
Each year was saved in a different format to simulate real-world multi-source ingestion:
Year | Format |
2015 | CSV |
2016 | Parquet |
2017 | Avro |
2018 | JSON |
Step 2 — Azure Data Lake Gen2
All 4 files were uploaded to Azure Data Lake Gen2 under a container called sourcesupplychaindataset with 3 folders:
sourcesupplychaindataset/
├── raw/        ← original uploaded files
├── processed/  ← copied by ADF pipeline
└── output/     ← final clean merged file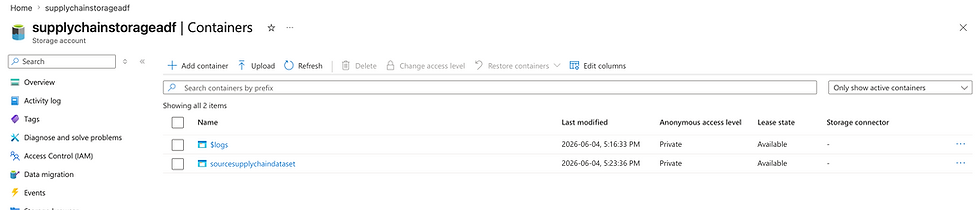

Step 3 — Azure Data Factory Pipeline
The ADF pipeline PL_SupplyChain_Master fully automates the data movement from raw to output with zero manual steps.
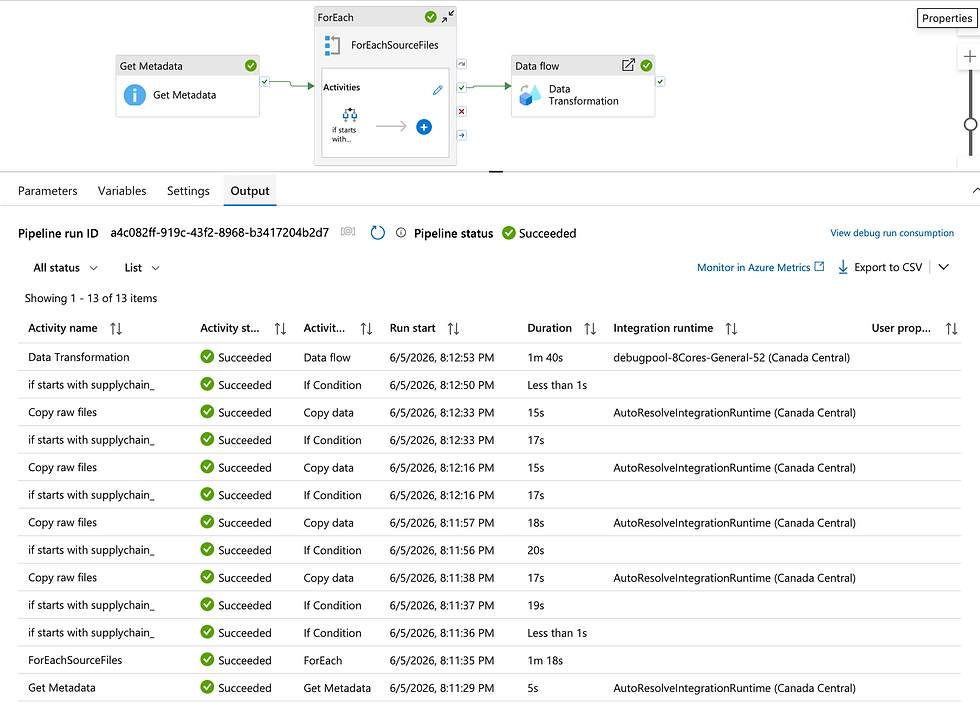
How it works:
Get Metadata → reads all files in the raw/ folder
ForEach → loops through every file found
IF Condition → filters only files starting with supplychain_
Copy Activities → copies each file to the processed/ folder
Data Flow → transforms, cleans, merges, and outputs the final file
Total pipeline run time: ~3-4 minutes for 180,000 records.
Step 4 — Data Flow Transformations
This is where the heavy lifting happens. The Data Flow uses Apache Spark under the hood to process all 4 files in parallel.

The 7-step transformation:
① Sources — 4 files read simultaneously (CSV, Parquet, Avro, JSON)
② Union — all 4 merged into one stream (52 columns)
③ Select — 10 unnecessary columns dropped
Removed: Customer Email, Customer Password, Product Image,
Product Description, Customer Street, Customer Zipcode,
Order Zipcode, Customer Id, Order Id, Order Department Id
④ Derived Column — data cleaning applied:
Date fix — 6 mixed formats standardized using coalesce():
MM/dd/yyyy | dd-MM-yyyy | yyyy/MM/dd |
MMMM dd, yyyy | dd MMM yyyy | yyyyMMdd
→ all converted to DATE type
Customer name — salutations removed:
MR.John Smith   → John Smith
MS.jane doe     → Jane Doe
MRS.MARY JONES  → Mary Jones
Product price — currency symbols removed:
$327.34 / USD 327.34 / 327.34USD → 327.34Delivery status — variants normalized:
LATE DELIVERY / late delivery / LATE → Late delivery
CANCELLED / canceled                 → Shipping canceled
ON TIME / on time                    → Shipping on time
⑤ Aggregate — duplicates removed using composite key:
Order Item Id + Customer Id = unique record⑥ Alter Rows — insert/upsert rules applied
⑦ Sink → output/supplychain_final.csv (7.36 MiB, 39 columns)

Step 5 — Power BI Dashboard
The final CSV was connected to Power BI via Azure Data Lake Gen2. A Date Table was created in DAX and linked to the order date column to enable time intelligence measures.

The dashboard has 6 interactive pages with slicers for Year, Market, Customer Segment, and Delivery Status — every visual filters dynamically.
Page 1 — Executive Summary
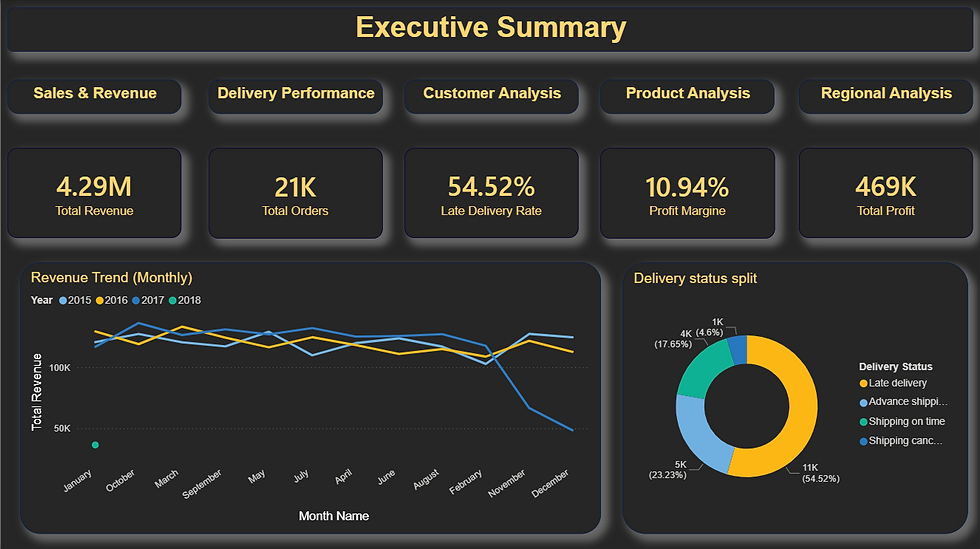
KPI | Value |
Total Revenue | $4.29M |
Total Orders | 21K |
Late Delivery Rate | 54.52% |
Profit Margin | 10.94% |
Total Profit | $469K |
Visuals: Monthly revenue trend by year · Delivery status donut chart
Page 2 — Sales & Revenue

KPI | Value |
MoM Growth | 0.86% |
YoY Growth | 43.47% |
Avg Order Value | $203.85 |
Total Discount | $979.43K |
Visuals: Revenue by Market (Europe leads $1.27M) · Revenue by Category treemap (Fishing $797.56K)
Page 3 — Delivery Performance

KPI | Value |
On Time Rate | 17.65% |
Avg Delay Days | 2 |
Shipping Efficiency | 84.16% |
Cancelled Orders | 4.60% |
Visuals: Late delivery risk by shipping mode · Actual vs scheduled shipping days trend
Page 4 — Customer Analysis

KPI | Value |
Unique Customers | 7K |
Revenue per Customer | $601.12 |
Repeat Customers | 3K |
Repeat Customer Rate | 45.34% |
Visuals: Revenue by segment · World map by city · Scatter: quantity vs profit
Page 5 — Product Analysis

KPI | Value |
Total Products | 117 |
Avg Product Price | $140.48 |
Profit per Product | $4.01K |
Discount Impact | 22.84% |
Visuals: Top 10 products by profit (Field & Stream $798K) · Bottom categories by discount impact
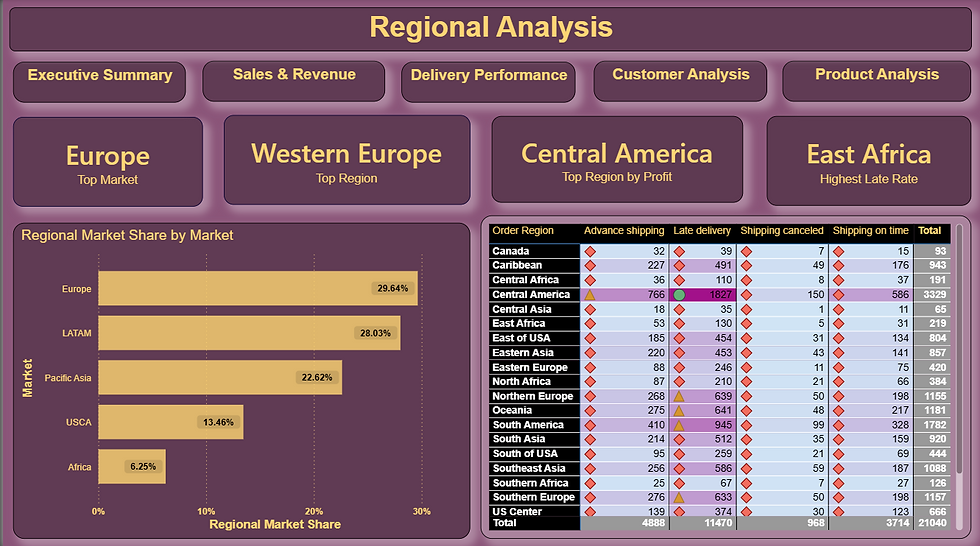
Page 6 — Regional Analysis
KPI | Value |
Top Market | Europe (29.64%) |
Top Region | Western Europe |
Top by Profit | Central America |
Highest Late Rate | East Africa |
Visuals: Regional market share · Order region vs delivery status matrix
Step 6 — UAT Validation with Azure SQL Database
After the dashboard was built, all Power BI metrics were validated using SQL queries in Azure SQL Database to ensure accuracy.
Sample Queries Below:
-- Total Revenue
SELECT ROUND(SUM(Sales), 2) AS Total_Revenue FROM supplychain;
-- Late Delivery Rate
SELECT ROUND(100.0 * COUNT(CASE WHEN Delivery_Status = 'Late delivery' THEN 1 END) / COUNT(*), 2)
AS Late_Delivery_Rate FROM supplychain;
-- Regional Market Share
SELECT Market,
ROUND(100.0 * SUM(Sales) / (SELECT SUM(Sales) FROM supplychain), 2) AS Market_Share_Pct
FROM supplychain GROUP BY Market ORDER BY Market_Share_Pct DESC;
Key Insights
54.52% of orders are delivered late — biggest operational issue
Europe + LATAM drive 57% of total revenue
Only 17.65% of orders ship on time
Standard Class shipping has the highest late delivery risk
Consumer segment contributes 52% of revenue
Central America is the most profitable region
Fishing category leads revenue at $797.56K
Discount impact is 22.84% — significant margin erosion
What I Learned
How to build a production-grade ADF pipeline with GetMetadata + ForEach + IF Condition
How to handle multi-format data sources (CSV, Parquet, Avro, JSON) in a single Data Flow
How to write complex ADF Data Flow expressions for date coalescing, regex cleaning, and type casting
How DAX time intelligence functions (SAMEPERIODLASTYEAR, DATESYTD, DATEADD) work
How to validate dashboard metrics using SQL UAT queries


Comments