Mortgage Lending Analytics - Azure Databricks Medallion Pipeline

Fair Lending Insights is an end-to-end data engineering pipeline built on the U.S. HMDA mortgage dataset (millions of loan records across 2013–2017). The goal was to ingest raw, multi-file government data, transform it through a medallion architecture on Azure Databricks, and surface business and fair-lending KPIs through SQL analytics including approval-rate gaps across demographic groups, the exact question the dataset was created to answer.
Tech Stack
Layer | Tool |
Cloud Storage | Azure Data Lake Gen2 |
Compute / Pipeline | Azure Databricks |
Transformation | PySpark (Apache Spark) |
Table Format | Delta Lake |
Governance | Unity Catalog |
Security | Service Principal + Azure Key Vault |
Analytics | Databricks SQL |
Language | Python, SQL |
Step 1 - The Dataset
The Home Mortgage Disclosure Act (HMDA) dataset is one of the most important public records of U.S. lending it exists specifically so regulators can detect discriminatory lending. It comes in two file types per year:
LAR (Loan Application Register) one row per mortgage application: amount, action taken, applicant demographics, geography. The fact table.
Panel - one row per lending institution: parent company, assets, identifiers. The dimension table.
The data is genuinely messy and realistic to work with: every column arrives as a string, schemas drift across years, numeric codes sit alongside their text labels, and many fields are legitimately sparse (co-applicant info, denial reasons). Five years of national records run into the millions of rows big enough to need Spark, not pandas.
Year | Files |
2013–2017 | LAR + Panel (zipped CSV) |
Step 2 - The Ingestion Challenge
The first real obstacle was getting the data at all. The CFPB file host sits behind Akamai bot-protection that blocks programmatic requests from datacenter IP ranges. Every standard approach returned 403 Forbidden header tweaks, full browser headers, Referer spoofing, even browser-TLS fingerprint impersonation. Official mirrors were either the same block (data.gov redirects to the blocked host) or login-gated (DataLumos).
The breakthrough was empirical: a Databricks cluster whose egress IP was not on Akamai's block list could pull the files directly. I verified one small file downloaded successfully before building the rest of the pipeline on top of it. Lesson learned when a source fights back, test the actual path before assuming it's impossible.
Step 3 - Azure Infrastructure
Resource Group
├── ADLS Gen2 storage account (hierarchical namespace)
│   ├── bronze container
│   └── silver container
├── Azure Databricks workspace
│   └── single-user compute cluster
└── Unity Catalog (catalog + Volume)
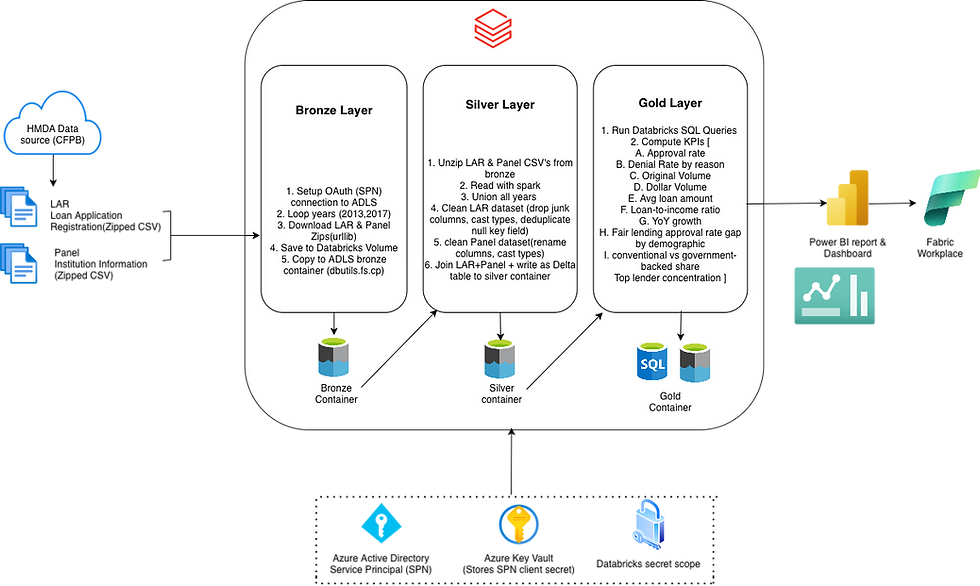
Access is secured the production way rather than with raw keys: a Service Principal authenticates Databricks to ADLS via OAuth, and its client secret lives in Azure Key Vault, surfaced to notebooks through a Databricks secret scope. No credentials in code.
Step 4 - The Medallion Pipeline
Three notebooks, designed to run in sequence - Bronze, Silver, Gold.
① Bronze - Raw Ingestion A parameterized notebook loops over 2013–2017, downloads each year's LAR and Panel zip from the CFPB site using Python urllib, and lands them in the bronze container, organized into lar/ and panel/ folders. A retry-and-wait mechanism handles transient server failures so one bad file doesn't kill the run.
② Silver - Clean & Join This is where the heavy lifting happens, using PySpark on Delta Lake.
Unzip & read - each year's CSVs read into Spark.
Union with schema drift handling unionByName(allowMissingColumns=True) aligns columns by name across years and fills gaps, instead of failing on mismatched schemas.
Drop redundant columns - each coded column (e.g. action_taken=1) ships alongside a readable twin (action_taken_name="Loan originated"). Kept the labels, dropped the codes, and removed sparse padding columns.
Type casting - counts cast to long, amounts and rates to double, and identifiers like census tract and state codes deliberately kept as string (leading zeros matter - they're labels, not quantities).
Deduplicate - exact duplicate rows removed.
Safe null handling - rows dropped only where key fields are missing, never a blanket dropna (which would have wiped out most rows, since demographic and denial fields are legitimately empty for most loans).
Fact–dimension join - LAR joined to Panel on respondent_id + agency_code + as_of_year, bringing institution names and assets onto every loan.
Sink - written as a clean, typed Delta table to the silver container.
③ Gold - Analytics The Silver Delta table is registered to Unity Catalog as hmda.silver_loans and queried directly with Databricks SQL - no separate serving database needed.
Step 5 - KPIs & Analysis
Ten KPIs computed in Databricks SQL, several using window functions (LAG, RANK, SUM() OVER ()):
# | KPI |
1 | Loan approval rate |
2 | Denial rate by reason |
3 | Total origination volume |
4 | Total dollar volume originated |
5 | Average loan amount by state |
6 | Loan-to-income ratio |
7 | Fair-lending approval-rate gap by demographic |
8 | Year-over-year origination growth |
9 | Conventional vs government-backed share |
10 | Top-lender market concentration |
A sample query the fair-lending KPI, computed live from Silver:
sql
SELECT applicant_race_name_1,
       COUNT(*) AS decided,
       ROUND(100.0 * SUM(CASE WHEN action_taken_name='Loan originated' THEN 1 ELSE 0 END)/COUNT(*), 1) AS approval_rate_pct
FROM hmda.silver_loans
WHERE action_taken_name IN ('Loan originated','Application denied by financial institution')
  AND applicant_race_name_1 IS NOT NULL
GROUP BY applicant_race_name_1
HAVING COUNT(*) >= 1000
ORDER BY approval_rate_pct DESC;
A note on KPI 7: a raw approval-rate gap across groups is a starting point for investigation, not proof of discrimination - it can reflect differences in income, loan size, or geography. The pipeline keeps income and loan-amount measures alongside it precisely so the gap can be contextualized rather than read naively.
What I Learned
How to build a medallion (Bronze → Silver → Gold) architecture on Azure Databricks with Delta Lake.
How to secure cloud access the production way - Service Principal + Key Vault + secret scope, no hardcoded keys.
How to handle a source that actively blocks automated ingestion, and how to verify a working path empirically instead of guessing.
How to handle multi-year schema drift cleanly with unionByName.
Why type choices matter - when an ID that looks numeric must stay a string, and when a blanket dropna would silently destroy a dataset.
How to model a proper fact–dimension join and turn raw lending records into business and fair-lending KPIs.
Key Insights
HMDA's "labels" files ship decoded labels alongside numeric codes a big head start on the usual decoding step.
The hardest part of a pipeline is often ingestion, not transformation a blocked source cost more effort than the entire medallion build.
Joining the small Panel dimension onto the large LAR fact table is what turns "loan rows" into "who lent how much, where, to whom" the difference between data and insight.


Comments