Global Superstore – Sales Analysis Dashboard | Power BI, Excel

The goal of this project was to analyze the Global Superstore sales dataset to understand how the business is performing across different countries, products, and customer segments.
The dashboard helps answer important business questions such as:
How much revenue the company generates
Which products and categories are most profitable
Which countries bring the most customers
How shipping methods affect customer behavior
Whether delivery delays affect customer satisfaction
Where the company should focus to increase profit
This analysis helps the business owner identify opportunities to increase sales, reduce cost, and improve operational efficiency.
The dataset contains 48 columns describing sales transactions.
Each row represents a single product order placed by a customer.
The dataset includes information about:
Data Type | Example Fields |
Customer information | customer name, age group, gender |
Location information | country, state, city |
Product information | product name, category, sub-category |
Order information | order date, shipping method |
Financial information | revenue, cost, profit |
Because the dataset contains many columns, not all of them were necessary for the business insights we wanted to generate.
Data Cleaning Process
Any missing values were checked and handled to avoid errors in analysis.
Some values were standardized to ensure consistency across records.
Examples include:
formatting date fields
standardizing category names
correcting inconsistent text values
Creating Derived Columns
Derived Field | Purpose |
Month | analyze seasonal trends |
Year | compare yearly performance |
Customer Age Group | segment customer demographics |
Profit Margin | evaluate profitability |
These transformations helped make the dataset more analytical and easier to visualize.
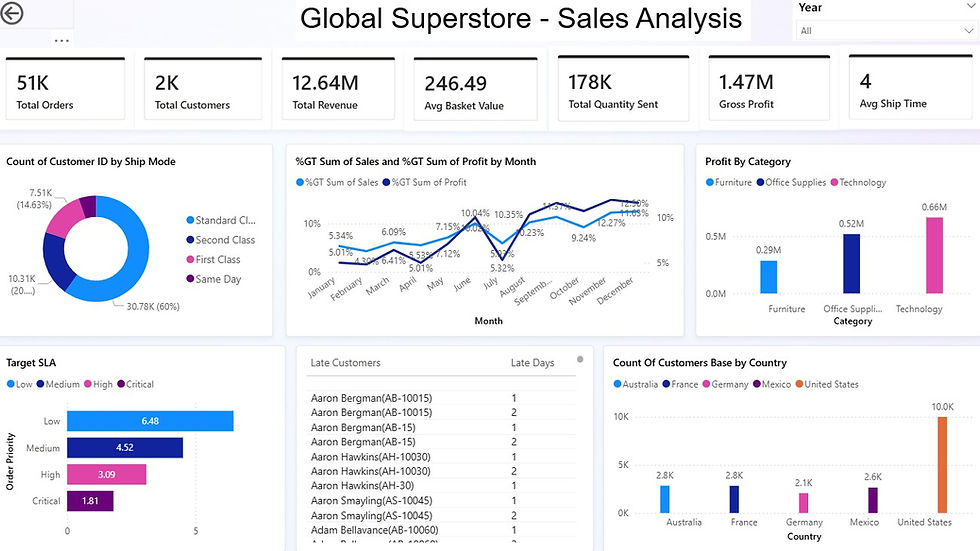
Total Orders
The business processed 51,000 orders.
This indicates strong customer activity across multiple markets.
Total Customers
There are around 2,000 customers in the dataset.
This means the company has a relatively large customer base generating repeat
purchases.
Total Revenue
The company generated $12.64 million in revenue.
Revenue represents the total sales value before subtracting costs.
Total Quantity Sold
The company shipped 178,000 units of products.
This shows the scale of product demand across regions.
Gross Profit
The total profit generated is $1.47 million.
While revenue is strong, profit margins can still be improved through better pricing and cost management.
Average Basket Value
The average order value is $246.
This indicates the typical amount customers spend per purchase.
Increasing this value through product bundling or upselling strategies could increase revenue.
Average Shipping Time
The average shipping time is 4 days.
Maintaining efficient shipping is critical to customer satisfaction and repeat purchases.
Shipping Method Preference
The shipping mode chart shows that most customers prefer:
Standard Class shipping
This suggests customers prioritize lower shipping cost over faster delivery.
The company could introduce loyalty incentives for faster shipping upgrades.
The monthly sales and profit trend shows how performance changes throughout the year.
Key observations:
Profit fluctuates month to month
Sales increase toward the end of the year
Some months show higher revenue but lower profit
This suggests that discounts or high operational costs may be reducing margins during certain periods.
Profit by category shows:
Category | Profit |
Technology | Highest profit |
Office Supplies | Moderate profit |
Furniture | Lowest profit |
Business Insight
Technology products generate the most profit.
The company should:
focus marketing on technology products
increase product variety in this category
analyze why furniture generates lower profit
Customer base is distributed across multiple countries.
The largest market is:
United States
Other markets include:
Australia
France
Germany
Mexico
Business Insight
The company should:
focus marketing efforts in high-performing regions
explore growth opportunities in underperforming countries
Delivery Performance (SLA Analysis)
The SLA chart analyzes delivery delays by priority.
Orders are categorized as:
Low priority
Medium priority
High priority
Critical priority
The analysis shows that lower priority orders experience the highest delays.
The company should improve logistics planning to reduce delays, especially during peak demand periods.
Late Customer Analysis
The dashboard identifies customers who received late shipments.
This information helps the company:
identify logistics issues
improve delivery planning
prevent customer dissatisfaction
Key Business Recommendations
Increase Focus on High Profit Products
Technology products generate the highest profit. Expanding this category could increase overall profitability.
Improve Furniture Profitability
Furniture products generate lower profit margins. The company should evaluate:
supplier costs
shipping expenses
pricing strategy
Expand in Strong Markets
Countries with high customer numbers should receive:
more marketing campaigns
better product availability
Improve Shipping Efficiency
Reducing delivery delays will improve customer satisfaction and retention.
Increase Average Order Value
This can be done through:
product bundles
cross-selling
discount incentives for larger purchases
Final Business Impact
This dashboard provides a clear view of sales performance, profitability, customer distribution, and operational efficiency.
By using these insights, the business can:
increase revenue
reduce operational costs
improve logistics performance
identify profitable product categories
make data-driven strategic decisions


Comments