Customer Churn Analysis | Excel, Power BI

The purpose of this project is to identify the reasons why customers leave a bank and to predict which customers are likely to leave in the future. It also analyzes the key factors that influence customer churn.
Looking at sample Dataset,

RowNumber—corresponds to the record (row) number and has no effect on the output.
CustomerId—contains random values and has no effect on customer leaving the bank.
Surname—the surname of a customer has no impact on their decision to leave the bank.
CreditScore—can have an effect on customer churn, since a customer with a higher credit score is less likely to leave the bank.
Excellent: 800–850
Very Good: 740–799
Good: 670–739
Fair: 580–669
Poor: 300–579
Geography—a customer’s location can affect their decision to leave the bank.
Gender—it’s interesting to explore whether gender plays a role in a customer leaving the bank.
Age—this is certainly relevant, since older customers are less likely to leave their bank than younger ones.
Tenure—refers to the number of years that the customer has been a client of the bank.
Normally, older clients are more loyal and less likely to leave a bank.
Balance—also a very good indicator of customer churn, as people with a higher balance in their accounts are less likely to leave the bank compared to those with lower balances.
NumOfProducts—refers to the number of products that a customer has purchased through the bank.
HasCrCard—denotes whether or not a customer has a credit card. This column is also relevant, since people with a credit card are less likely to leave the bank.
1 represents credit card holder
0 represents non credit card holder
IsActiveMember—active customers are less likely to leave the bank.
1 represents Active Member
0 represents Inactive Member
Estimated Salary—as with balance, people with lower salaries are more likely to leave the bank compared to those with higher salaries.
Exited—whether or not the customer left the bank.
0 represents Retain
1 represents Exit
Bank DOJ — date when the Customer associated/joined with the bank.

This project uses a star schema data model, which is commonly used in data warehousing and analytics because it makes querying and reporting easier and faster.
In this model, the Bank_Churn table is the central fact table. The fact table contains the main measurable information about customers such as Age, Balance, Credit Score, Estimated Salary, and whether the customer exited the bank. It also stores the foreign keys that connect to other tables.
Around the fact table, there are several dimension tables, including Gender, Geography, CreditCard, ActiveCustomer, ExitCustomer, DateMaster, and CustomerInfo. These tables contain descriptive information that helps analyze the data in different ways. For example, the Gender table describes the customer’s gender, the Geography table stores the customer’s location, and the CreditCard table describes wheather a customer has credit card or not.
The relationships between the fact table and dimension tables follow a one-to-many relationship. This means one record in a dimension table can relate to many records in the fact table. For example, one Gender category (Male or Female) can be associated with many customers in the Bank_Churn fact table.

There are 10,000 total customers, out of which 2,037 customers have exited, giving us a churn rate of roughly 20%, while 7,963 customers are retained.
Looking at churn by age group, we see that middle-aged customers have the highest churn, with around 1,457 exited customers, followed by adult customers with about 499 exits.
In contrast, retired customers (55) and young adults (26) show significantly lower churn.
This suggests that mid-career customers are the most likely to switch banks, possibly due to financial product comparison, better loan rates, or improved banking benefits offered by competitors.
From the geographical analysis:
Germany: ~814 exited customers
France: ~810 exited customers
Spain: ~413 exited customers
Germany shows the highest churn, closely followed by France, while Spain has the lowest.
This indicates that churn is more concentrated in Germany and France, which could reflect stronger competition, pricing differences, or customer service factors in those markets.
When analyzing churn by credit score category:
Fair credit: 685 exits
Poor credit: 520 exits
Good credit: 452 exits
Very good credit: 252 exits
Excellent credit: 128 exits
Customers with fair and poor credit scores represent the largest portion of churn, while excellent credit customers churn the least.
This suggests that customers with mid-to-low credit profiles may be more sensitive to fees, interest rates, or credit offers, making them more likely to switch banks.

From the tenure analysis:
Tenure 4: ~575 exits
Tenure 5: ~550 exits
Tenure 6: ~418 exits
Tenure 3: ~276 exits
Tenure 7: ~218 exits
Customers with mid-level tenure (around 4–5 years) show the highest churn.
This indicates that churn risk increases during the middle stage of the customer relationship, suggesting that retention programs may be particularly important during this period.
The analysis of credit card ownership shows:
Customers with credit cards: ~69.9% of exited customers
Customers without credit cards: ~30.1% of exited customers
This suggests that a majority of churned customers were credit card holders, which may indicate dissatisfaction with credit card fees, benefits, or reward programs.
Balance analysis shows the following churn pattern:
High balance: ~987 exits
Very low balance: ~504 exits
Medium balance: ~300 exits
Very high balance: ~205 exits
Low balance: ~22 exits
Extreme balance: ~19 exits
Customers with high balances and very low balances show higher churn, while those with medium balances tend to stay longer.
This could indicate two behaviors:
Low-balance customers may not be highly engaged with the bank.
High-balance customers may move to competitors offering better investment opportunities or premium banking services.
The monthly churn analysis shows variation across months, with noticeable peaks during certain periods such as December and October.
These fluctuations suggest that churn may be influenced by:
seasonal financial behavior
marketing campaigns from competing banks
year-end financial planning or loan refinancing
Final Business Conclusion
Overall, churn appears to be influenced by age group, geography, credit score, balance levels, and tenure.
Key insights for the bank include:
Target middle-aged customers with loyalty and retention programs
Investigate churn drivers in Germany and France
Improve engagement for low-balance customers
Provide premium services or investment benefits for high-balance customers
Enhance credit card rewards and benefits to reduce churn among cardholders
Implementing targeted retention strategies for these segments could help significantly reduce customer churn and improve long-term customer loyalty.
Data Preparation and Derived Fields
In order to support the analysis and dashboard development, several derived fields were created from the original dataset. These transformations helped standardize the data and enabled easier segmentation for analysis.
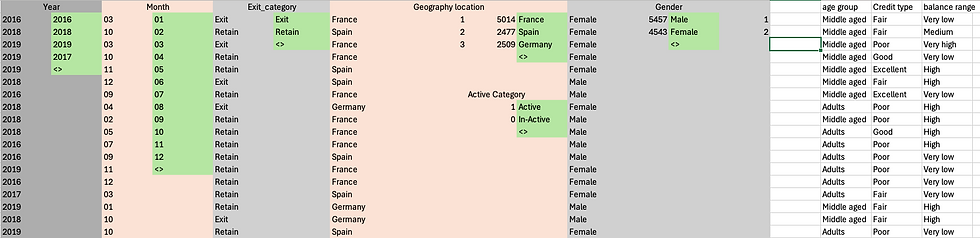
Geography Location Categorization
Geography values were encoded numerically for consistency:
Code | Country |
1 | France |
2 | Spain |
3 | Germany |
Gender Categorization
Code | Gender |
1 | Male |
2 | Female |
Active / Inactive Customer Category
Code | Status |
1 | Active |
0 | Inactive |
Age Group Classification
Customers were grouped into age segments to analyze churn behavior by life stage.
Age Condition | Category |
age < 18 | Kids |
18 ≤ age < 24 | Young Adults |
24 ≤ age < 39 | Adults |
39 ≤ age < 64 | Middle Aged |
age ≥ 64 | Retired |
Credit Score Category
Customers were segmented based on credit score ranges.
Credit Score Range | Category |
800–850 | Excellent |
740–799 | Very Good |
670–739 | Good |
580–669 | Fair |
300–579 | Poor |
Balance Range Standardization
Balance values were grouped into meaningful ranges to identify patterns in customer behavior.
Balance Range | Category |
balance < 25,000 | Very Low |
25,000 – <50,000 | Low |
50,000 – <100,000 | Medium |
100,000 – <150,000 | High |
150,000 – <200,000 | Very High |
≥200,000 | Extreme |
Excel Techniques Used
To derive these fields and prepare the validation dashboards, several Excel functions were used:
UNIQUE() – to identify distinct category values
SORT() – to organize categorical values
Data Validation – to create dropdown filters (Year, Month, Category filters)
INDEX + MATCH – to dynamically retrieve filtered results
COUNTIFS() – to calculate conditional counts such as exited customers by segment
Pivot-like aggregations using formulas
Charts for quick visual validation
You are also correct that lookup functions could be used.
For example:
Using Lookup Tables
Instead of writing nested IF statements, you could create mapping tables and use:
VLOOKUP
XLOOKUP
INDEX + MATCH
Example:
=VLOOKUP(GeographyCode, Geography_Table, 2, FALSE)This approach is more scalable and easier to maintain, especially in real production data pipelines.
Ad-Hoc Testing Performed
To ensure the Power BI dashboard results were correct, ad-hoc testing was performed using Excel calculations.
What is Ad-Hoc Testing?
Ad-hoc testing is an informal validation technique where analysts manually verify results without predefined test cases. It helps quickly detect inconsistencies or calculation errors.
How Ad-Hoc Testing Was Applied
The following validation steps were performed:
Random filter combinations were applied in Power BI (year, geography, gender, etc.).
The same filters were manually applied in Excel.
Conditional formulas such as COUNTIFS() were used to recompute metrics.
Results were compared between Excel and Power BI.
Any discrepancy would indicate a logic or aggregation issue in the dashboard calculations.
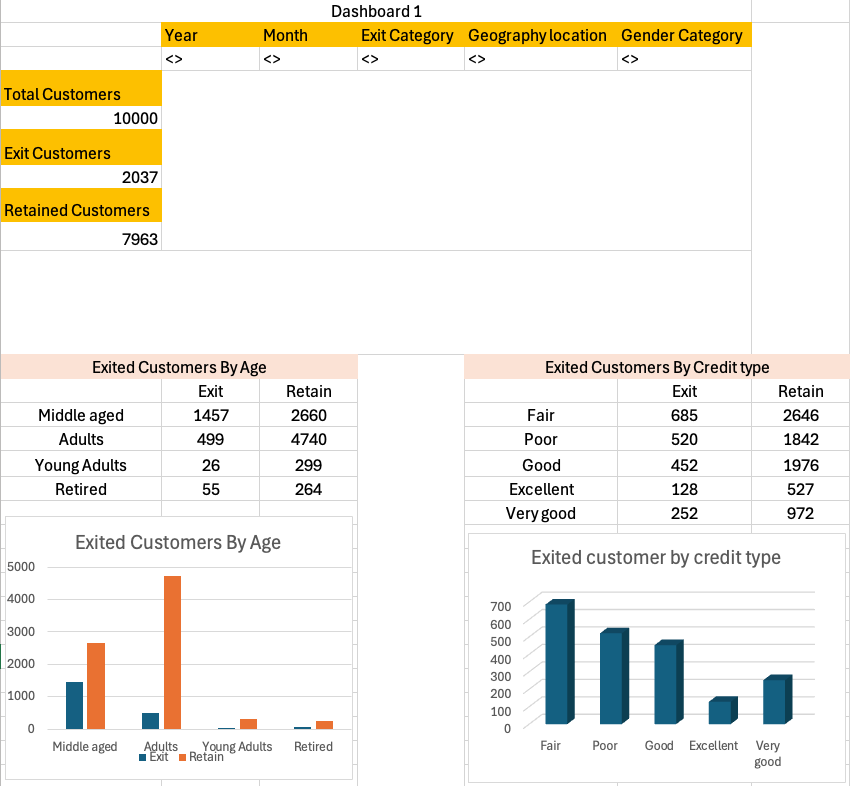
This dashboard validates customer churn metrics by allowing filtering across Year, Month, Exit Category, Geography Location, and Gender Category. It verifies key metrics including Total Customers, Exited Customers, Retained Customers, Exited Customers by Age, and Exited Customers by Credit Type. By applying different filter combinations, the dashboard ensures that the calculated results in Excel match the trends and aggregations displayed in the Power BI dashboard.

This dashboard analyzes customer activity and financial behavior using filters for Year, Month, and Active Category. It validates metrics such as Total Customers, Active Customers, Inactive Customers, Credit Card Holders, Exited Customers by Tenure, and Exited Customers by Balance Range. The dashboard helps confirm that the aggregation logic implemented in Power BI produces consistent and accurate results when replicated in Excel.
Github : Customer Churn Analysis


Comments